Estimating the total number of food poisoning cases—including the number of patients, hospitalisations, and deaths—as well as ranking the pathogens involved, is not a straightforward task. The study I am introducing today, led by Dr. Scallan and colleagues from the U.S. Centers for Disease Control and Prevention (CDC), attempts to estimate the number of foodborne illness cases in the United States attributable to different pathogens. Their estimation relies on statistical modelling, active and passive surveillance systems, and additional data sources.
Reference:
Scallan et al.
Foodborne Illness Acquired in the United States—Major Pathogens,
Emerging Infectious Diseases 17, No. 1, January 2011
This paper is freely available on PubMed Central (PMC).
Why Estimating Foodborne Illnesses Is Difficult
The complexity of estimating national totals stems from several factors:
- Food poisoning may be caused by a range of microbial agents, including bacteria, viruses, and parasites.
- Some pathogens are also transmitted via non-foodborne routes such as animal contact or contaminated water.
- Individual susceptibility varies; for example, the same contaminated food may cause illness in one person but not in another, depending on factors like age and immune status.
- Official statistics only capture reported cases—those where individuals seek medical care and where incidents are properly classified by public health authorities.
Summary of the Study’s Estimations
Dr. Scallan’s team focused on 31 major foodborne pathogens and derived the following annual estimates for the United States:
- Total cases: 9.4 million (90% credible interval [CrI] 6.6 to 12.7 million)
- Hospitalisations: 55,961 (90% CrI 39,534 to 75,741)
- Deaths: 1,351 (90% CrI 712 to 2,268)
Breakdown by Pathogen
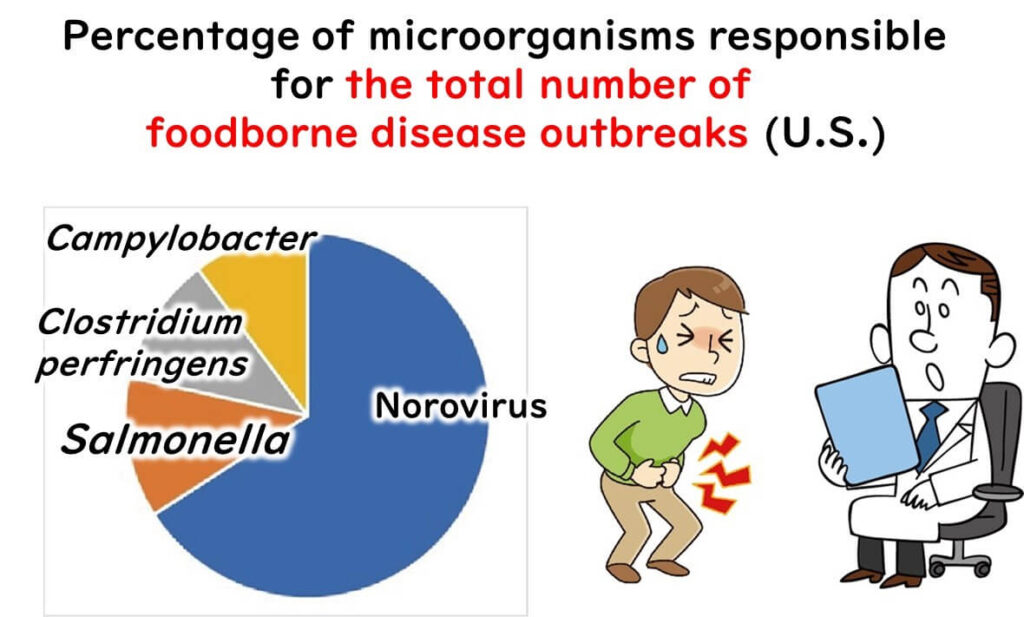
Pathogens Causing the Most Illnesses
- Norovirus (58%)
- Salmonella (11%)
- Clostridium perfringens (10%)
- Campylobacter (9%)
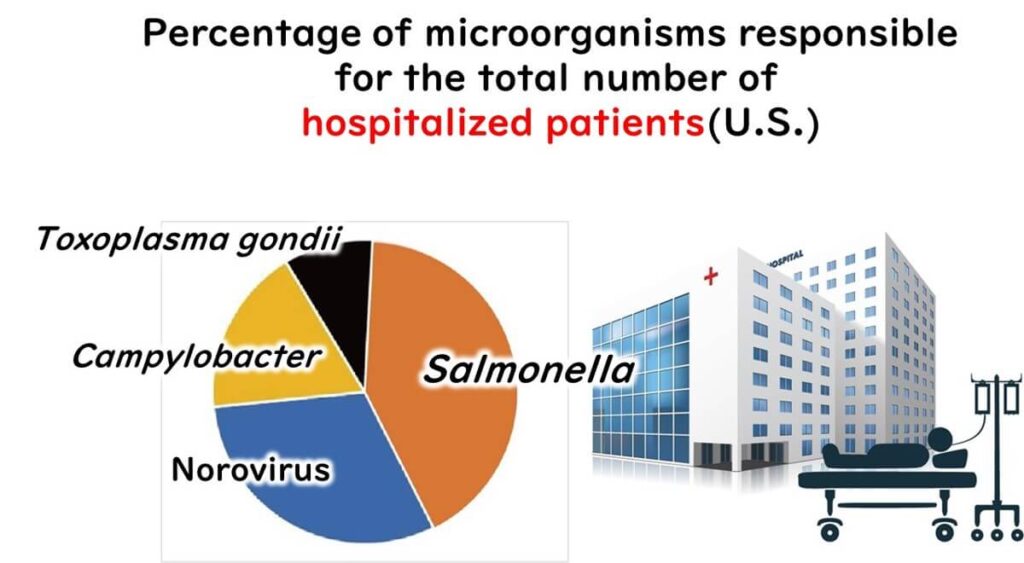
Pathogens Responsible for Most Hospitalisations
Salmonella (35%)
Norovirus (26%)
Campylobacter (15%)
Toxoplasma gondii (8%)
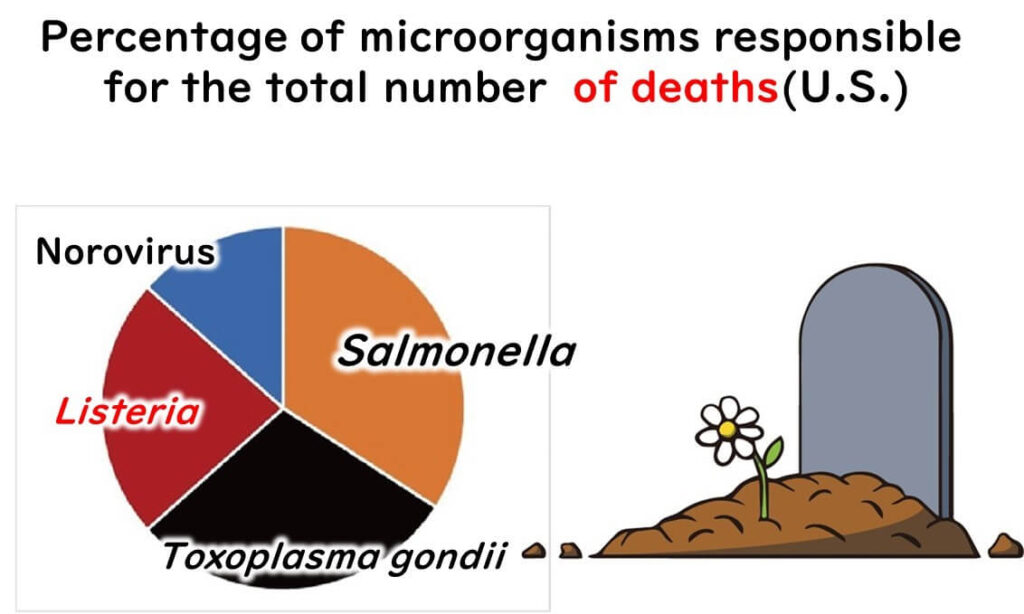
Pathogens Linked to Most Deaths
Salmonella (28%)
Toxoplasma gondii (24%)
Listeria monocytogenes (19%)
Norovirus (11%)
Observations on Pathogen Severity and Frequency
High-Frequency, Low-Severity Pathogens
- Clostridium perfringens: Ranks third in number of cases but leads to few hospitalisations.
- Campylobacter: Relatively common and causes hospitalisations, but rarely results in death.
Low-Frequency, High-Severity Pathogens
- Toxoplasma gondii: Though not common, ranks second in deaths.
- Listeria monocytogenes: Also infrequent, yet causes a high number of deaths—comparable to Salmonella and Toxoplasma gondii.
High Impact Across All Metrics
Norovirus: Leads in case numbers, second in hospitalisations, and fourth in deaths.
Salmonella and Norovirus both rank high across cases, hospitalisations, and deaths.
Salmonella: Though fewer in cases than Norovirus, it causes more hospitalisations and nearly three times the deaths.
My Take on This Study

What struck me most in this study is how it underscores the importance of viewing foodborne pathogens through multiple lenses: not just frequency, but also severity and public health impact. From my perspective, the key takeaway is that common assumptions—such as equating prevalence with danger—do not always hold true. For example, Clostridium perfringens causes many illnesses but is rarely severe, whereas Listeria monocytogenes, though rare, can be deadly.
This has profound implications for food safety practice. Quality assurance professionals must consider not only how often a pathogen appears in testing, but also its potential to cause serious harm. Risk assessments and HACCP plans should be tailored accordingly.
This confirms what I’ve long emphasised in training food handlers: that prioritising based on both frequency and severity yields a more effective control strategy than focusing on numbers alone.