PCR primer design is a cornerstone of accurate and reliable microbial detection in food microbiology. This article explores essential principles, including optimal primer length, GC content, Tm value, and strategies to avoid common issues like primer dimers. Master these concepts to elevate the precision and efficiency of your PCR-based testing.
Performance of PCR Primers
In a PCR reaction, amplifying a specific gene sequence requires attaching a gene fragment that serves as the starting point for extension to the target gene. This gene fragment, called a primer, must bind to the double-stranded DNA, flanking the gene sequence region to be amplified. Two primers are required: one for the upstream region and one for the downstream region, oriented in opposite directions.
When detecting microorganisms directly from food using PCR testing, it is ideal to target genes specific to the microorganism of interest. For most foodborne pathogens, primers targeting toxin genes or pathogenicity-related genes have been developed, establishing effective detection methods. However, for bacterial groups where molecular markers (specific gene sequences unique to the bacterium) are difficult to identify, many detection methods remain undeveloped. In some cases, even if the gene is not unique to the target bacterium, differences in gene sequences among similar bacteria can enable the identification of the target bacterium.
For example, our lab has identified the gene for histidine decarboxylase—an enzyme responsible for histamine production—in histamine-producing bacteria (Gram-negative bacteria) isolated from seafood. Using the conserved amino acid sequence among these bacteria as the primer region (shown as black shading in the figure), we developed a PCR detection method for these bacteria.
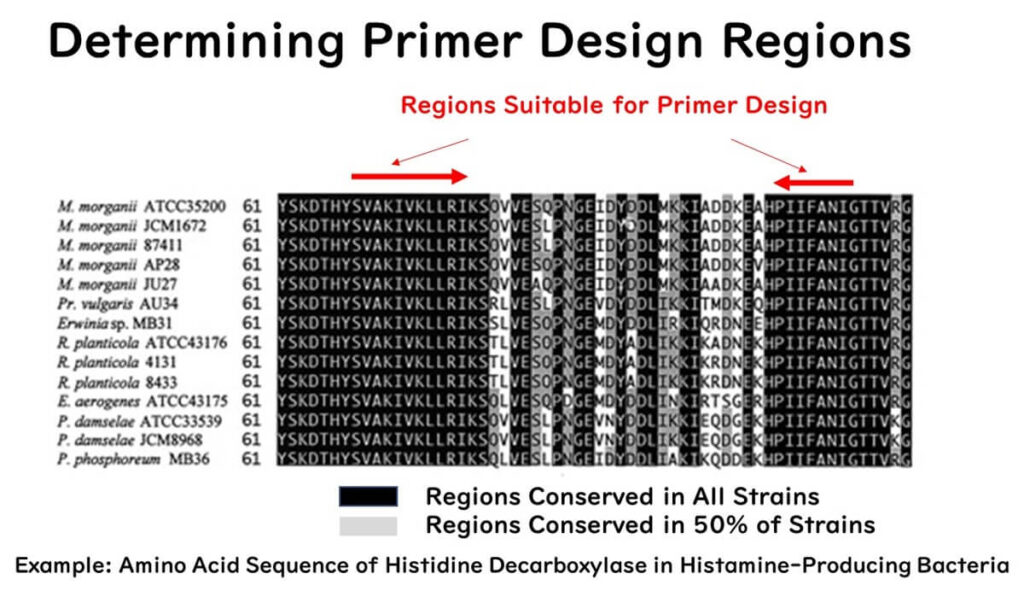
To develop an original PCR detection method for specific microorganisms in food microbiological testing, it is crucial to first identify the molecular marker gene sequence of the target microorganism. Alternatively, potential molecular marker gene sequences can be downloaded from databases and compared to establish specificity.
Primer Length
Understanding the basic principles of primer length is essential when designing your PCR reaction system. Primers should ideally be 18–24 base pairs (bp) long to balance specificity and efficiency.
Why is this the case?
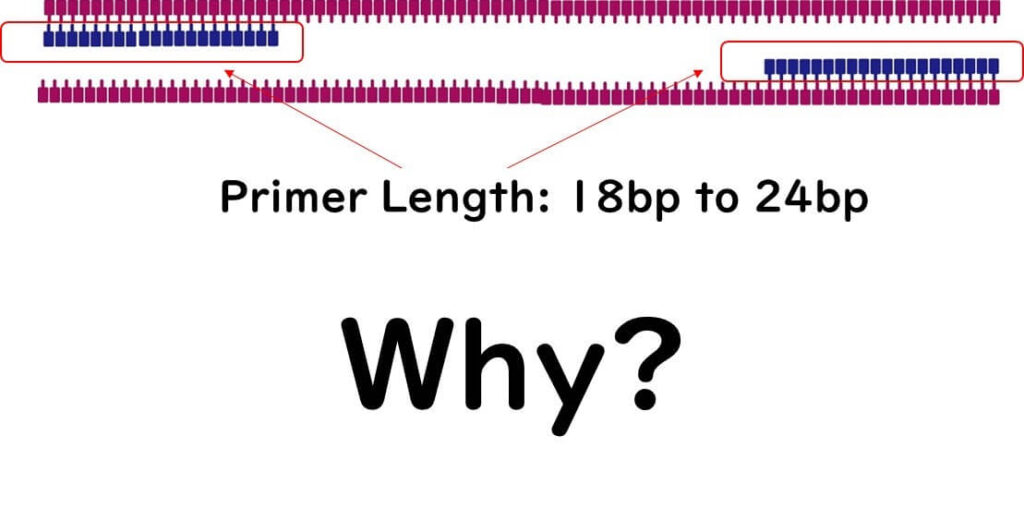
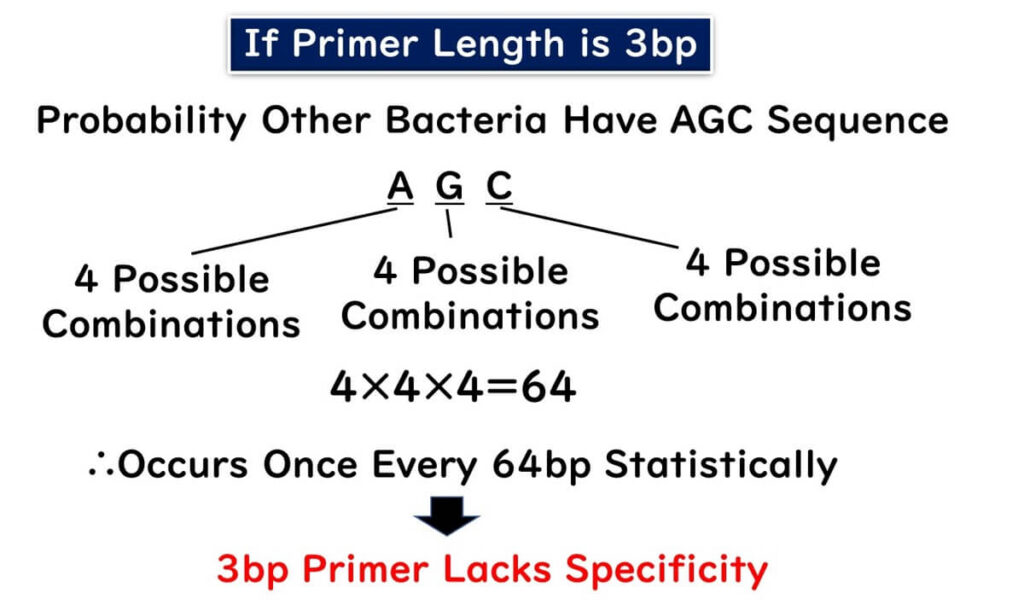
Firstly, consider the scenario where the primer is too short. Imagine a primer with a length of 3 bp, as shown in the figure below. A simple probability calculation reveals that the sequence AGC would appear once every 64 nucleotides:
4×4×4==64
This means that almost every bacterium would have this sequence.
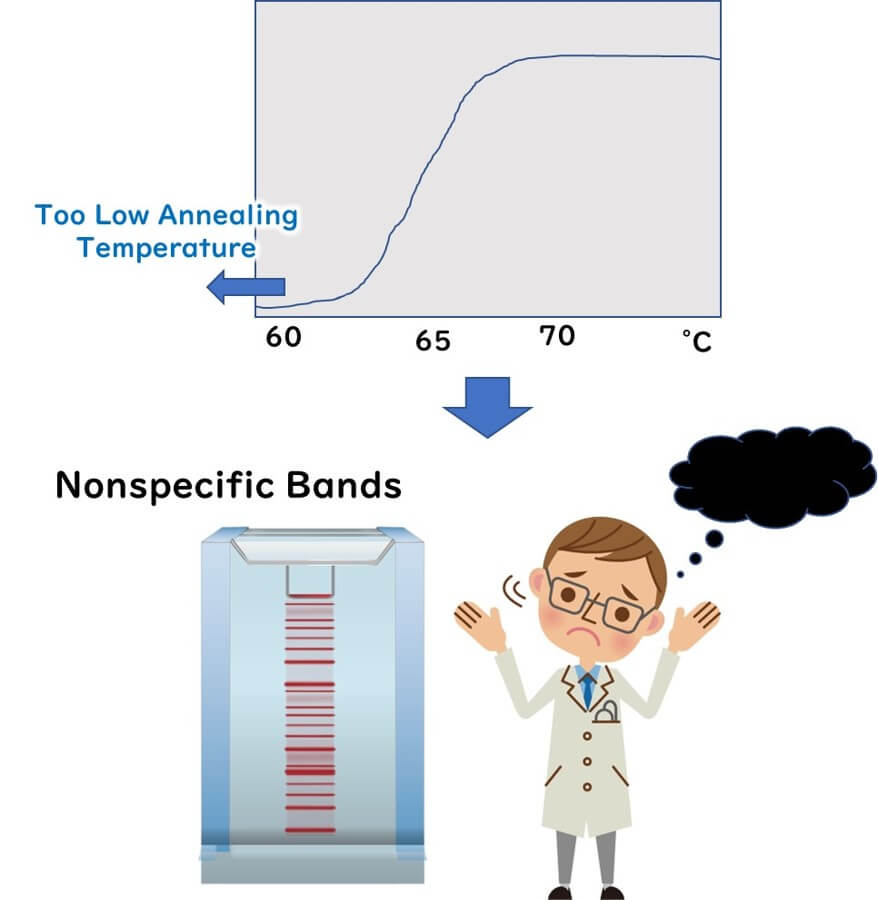
If such a short primer were used in a PCR reaction, non-specific bands would appear, as demonstrated in the figure below.

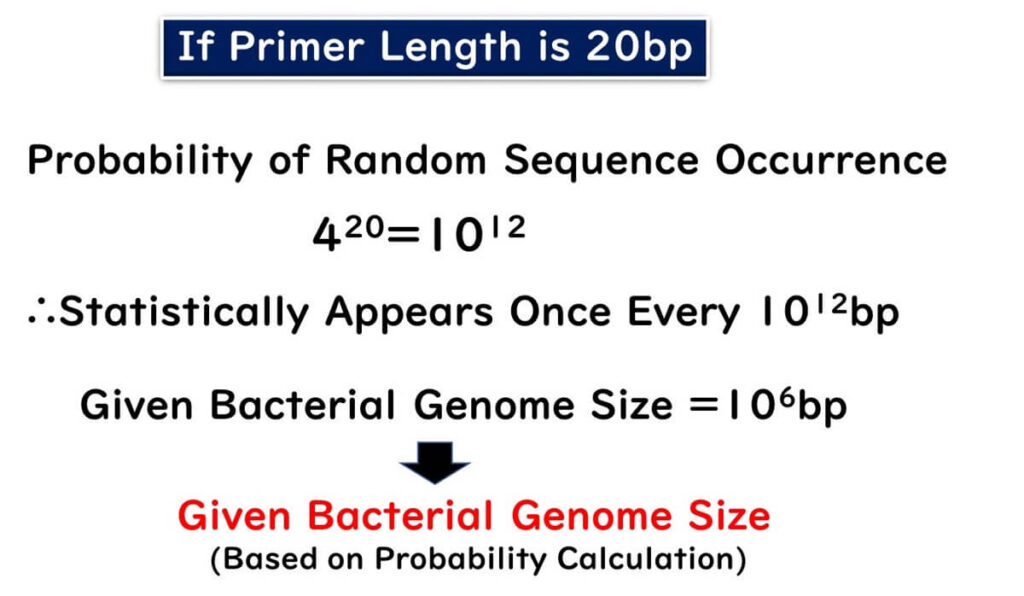
On the other hand, what happens if the primer length is set to 20 bp?
The probability of this sequence occurring by chance is:
420=1012
Given that the entire bacterial genome is approximately 106 bp, the probability of this sequence randomly occurring in another bacterium is 1 in 106. Therefore, setting the primer length to 20 bp ensures detection specificity.
Moreover, using forward and reverse primers with similar specificity further enhances detection precision.

However, this calculation is based on a simplistic probability theory. In reality, similar genes exist, and many gene sequences are closely related to the molecular markers of the target bacteria. Thus, even a primer length of 20 bp may not always guarantee perfect specificity.
What happens if the primer length is increased further to ensure more specificity?

There are two main drawbacks to excessively long primers:
- Slower annealing: Annealing takes longer, which slows down the PCR reaction.
- Increased secondary structures: The likelihood of primers forming secondary structures, such as hairpins, increases.
Thus, primers longer than 24 bp are not suitable for PCR reactions.

Tm Value and Annealing Temperature
In PCR reactions, the target DNA, which has been dissociated into single strands during the heat denaturation process, must rebind during the annealing phase. During this phase, primers that serve as starting points for extending the target sequence must also bind to the target DNA.
The temperature at which primers and template DNA adhere during the PCR reaction is called the annealing temperature.
The Tm value (Melting Temperature) is the temperature at which 50% of the primer forms a double strand with the target sequence. This value is a critical factor in primer design for PCR reactions.
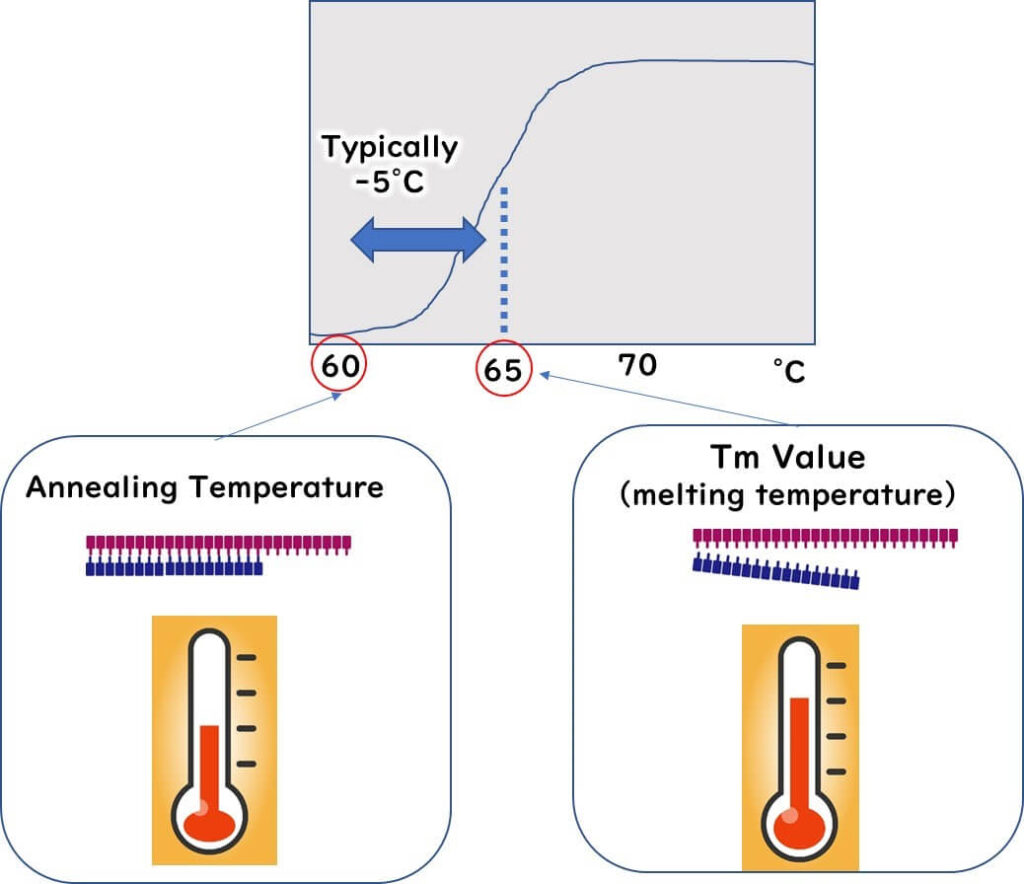
To ensure proper primer binding at the annealing temperature, lower temperatures make it easier for primers to adhere. However, setting the annealing temperature too low can lead to non-specific binding to the template DNA, resulting in numerous non-specific bands. Therefore, the annealing temperature should not be set too low.
General Guidelines for Annealing Temperature
The annealing temperature is typically set 5°C lower than the Tm value of the primers.
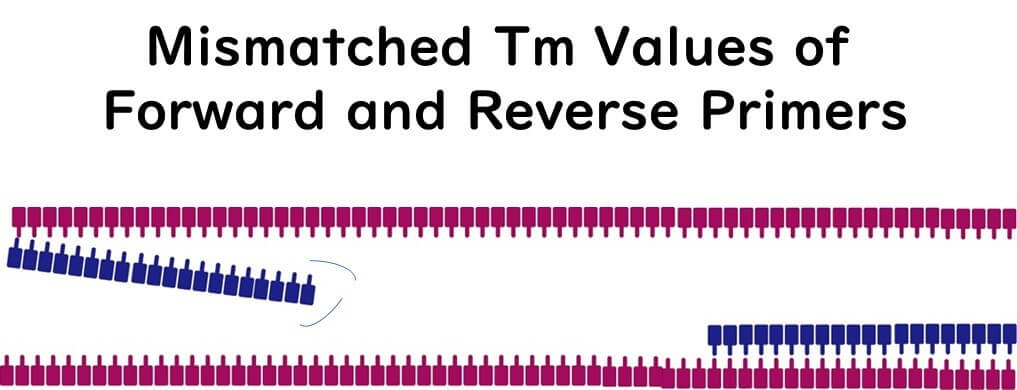
To ensure both forward and reverse primers bind correctly to the target DNA, their Tm values must be similar. Significant differences between Tm values can compromise binding efficiency.
How is the Tm Value Calculated?
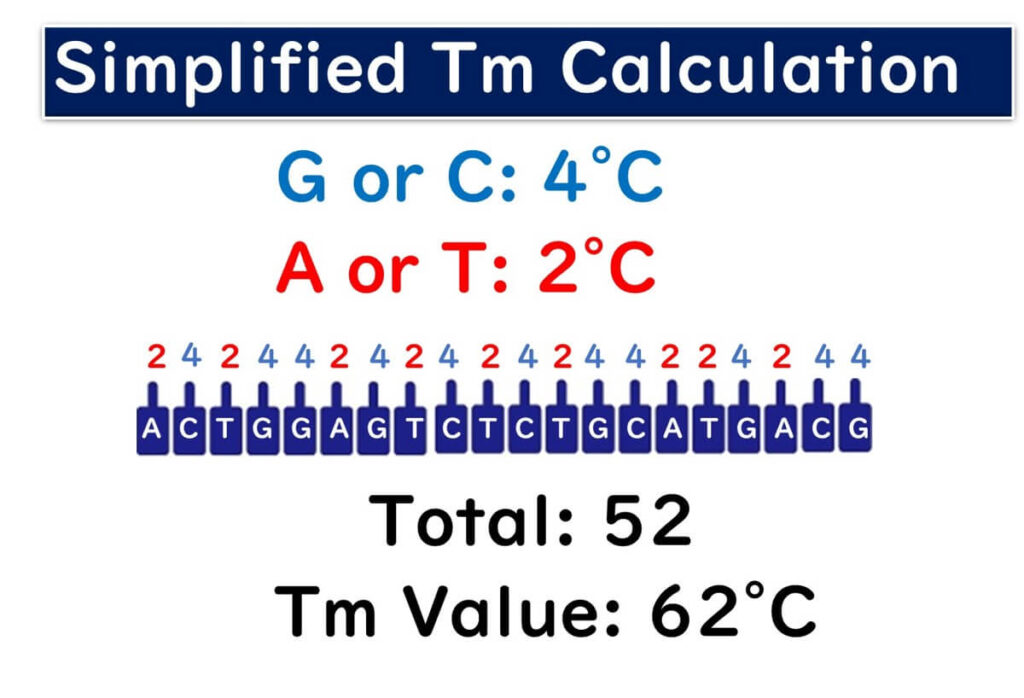
Various formulas exist for calculating Tm values. Below is the simplest manual calculation method:
- Assign 4°C for each G or C base.
- Assign 2°C for each A or T base.
For example, if the sequence is as shown in the figure below:
2℃+4 ℃ +2 ℃ +4 ℃ +4 ℃ +2 ℃ +4 ℃ +2 ℃ +4 ℃ +2 ℃ +4 ℃ +2 ℃ +4 ℃ +4 ℃ +2 ℃ +2 ℃ +4 ℃ +2 ℃ +4 ℃ +4 ℃ =62℃
Thus, the Tm value for this sequence is 62°C.
When designing primers, it is essential to not only consider the conservation of the gene region but also calculate the Tm values for both primers and ensure there is no significant difference between them.
GC Content
The stability of binding between primers and target DNA is significantly influenced by the GC content of the primer's DNA sequence.
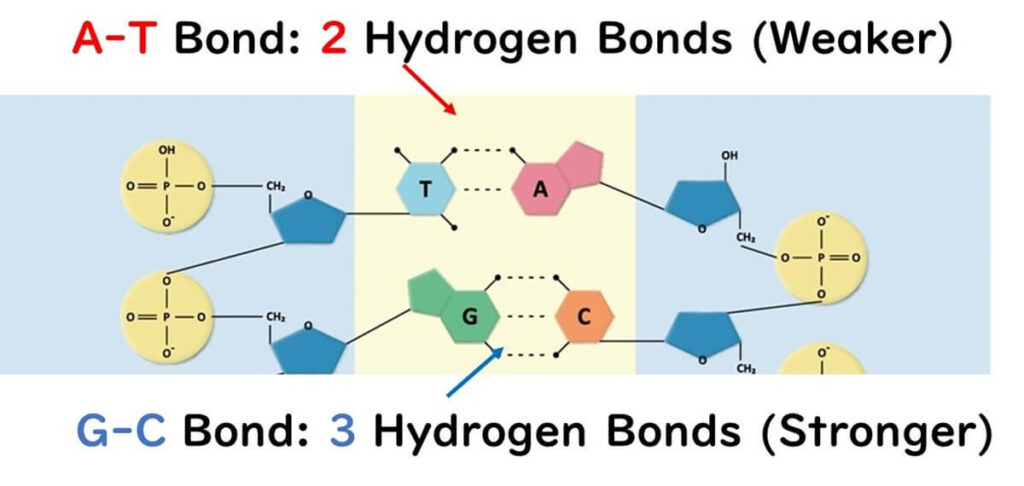
DNA sequences are composed of four bases: adenine (A), thymine (T), guanine (G), and cytosine (C). In double-stranded DNA, AT pairs form two hydrogen bonds, while GC pairs form three hydrogen bonds. This makes sequences with higher GC content more resistant to denaturation during PCR.
In the simple Tm value calculation introduced earlier, G and C are assigned 4°C, and A and T are assigned 2°C because of the bond strength differences.
Ideal GC Content for Primers
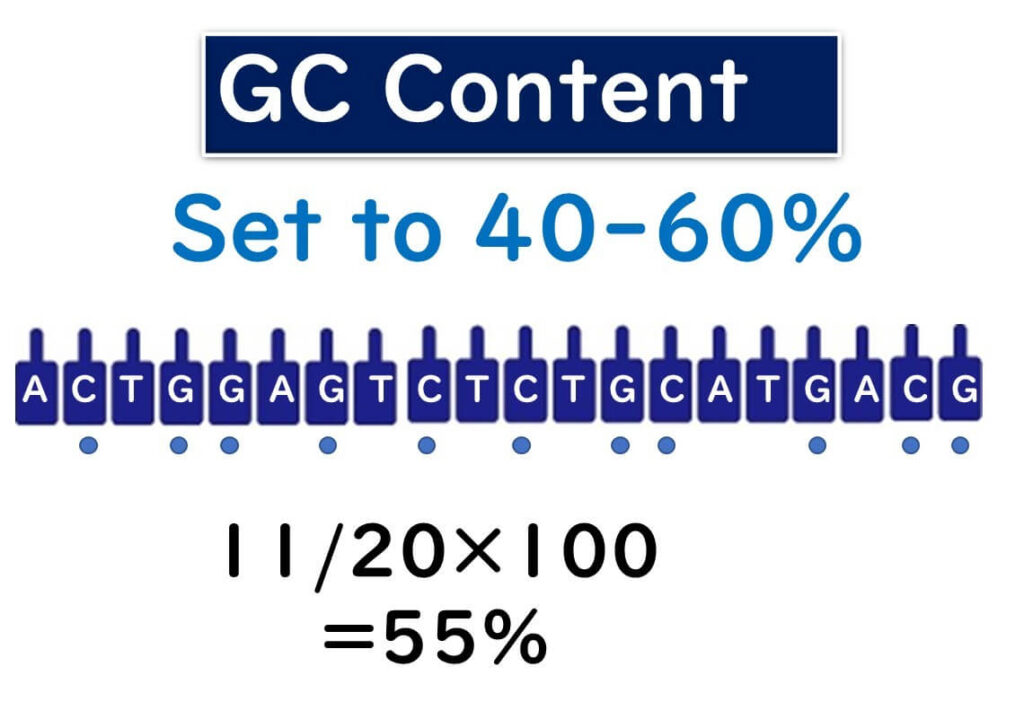
Primers used in PCR should have a GC content between 40-60%. This range ensures a balance between stability and flexibility during the binding process.
Calculating GC Content
The GC content of a primer can be calculated using the formula:
GC Content (%) = (Number of G or C bases / Total number of bases in the primer) × 100
The Importance of the 3' End
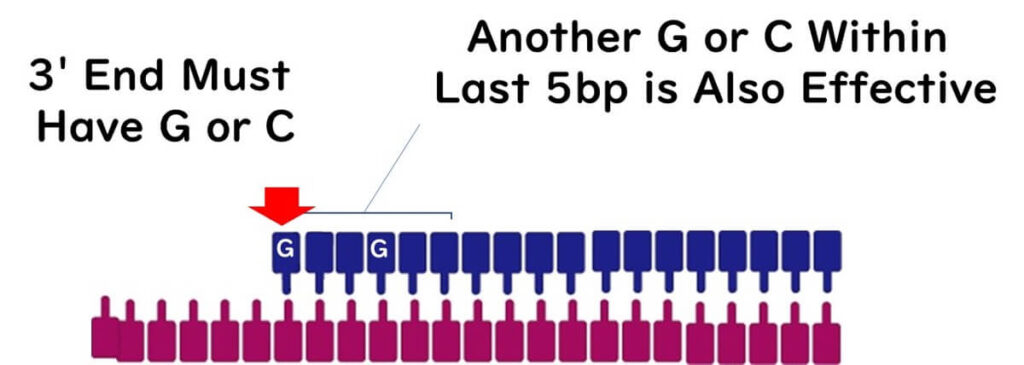
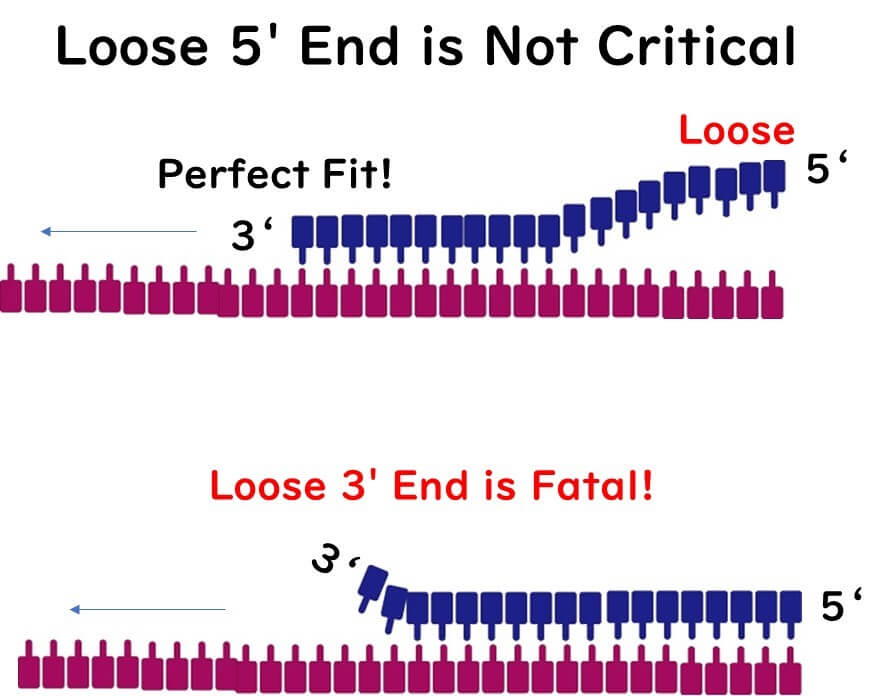
The 3' end of the primer plays a crucial role in PCR because it is where DNA polymerase recognizes and begins the extension process. Ideally, the 3' end should end with a G or C base due to the strong bonding provided by GC pairs, ensuring firm attachment.
However, avoid placing more than three G or C bases at the 3' end, as this can lead to non-specific PCR amplification.
Including another G or C base within five bases of the 3' end can further stabilize the primer.
The Role of the 5' End
Conversely, the 5' end of the primer can tolerate a higher content of A or T bases. As long as the 3' end remains stable, the extension reaction will proceed efficiently.
Key Considerations
When designing primers for PCR reactions, it is important to focus on both:
- Overall GC content: Maintain the recommended 40-60% range.
- Specific placement of G and C bases: Ensure proper distribution, particularly near the 3' end, to optimize stability and specificity.
Hairpins and Primer Dimers
One crucial aspect of PCR primer design is avoiding two potential problems that can arise from primer sequences:
Hairpin Secondary Structures
Hairpins occur when complementary sequences within a single primer align with each other. These sequences can bind together, causing the primer to fold into a hairpin structure, as illustrated below. Hairpin formation prevents the primer from binding effectively to the target DNA, reducing PCR efficiency.
Primer Dimers
Primer dimers form when the forward and reverse primers contain complementary sequences and bind to each other instead of the target DNA. This binding produces unintended amplification products, as shown in the figure below, and compromises the accuracy of the PCR reaction.
Why Avoiding Hairpins and Dimers is Critical
To minimize these issues, follow these guidelines:
- Check for Complementarity: Use software tools to identify and avoid complementary sequences within primers (for hairpins) and between forward and reverse primers (for dimers).
- Avoid Excessive GC Content: High GC content near the ends of primers can increase the likelihood of forming secondary structures.
- Validate Primers: Perform in silic testing to simulate primer performance and detect potential issues before conducting actual PCR.

