Introduction to Food Microbiology and Safety
Understanding the Accuracy of Microbial Testing of Food
To ensure food safety, it's essential to grasp the purpose of microbial testing and understand its accuracy. How likely are we to correctly detect contaminated food through microbial testing? For example, what is the probability of a false negative result when testing food samples with a 10% contamination rate if we test three samples? Alternatively, how many samples need to be tested to achieve 95% accuracy in detecting contamination in food samples with a 10% contamination rate? This article will guide you through these calculations step-by-step, using Excel for ease of understanding and application.
Probability Basics Through a Simple Analogy
Let's Start with a Basic Problem Question:
If 10 out of 100 lottery tickets are winners (10% winning rate), what happens if you buy 10 tickets?

Unfortunately, there is a chance that all 10 tickets could be losers.

The probability of all 10 tickets being losers is 35%.

If you struggled with maths in primary school, the mention of probability might make you want to run away.

However, this calculation isn't too difficult. Let's break it down step-by-step.

Calculating the Probability Step-by-Step
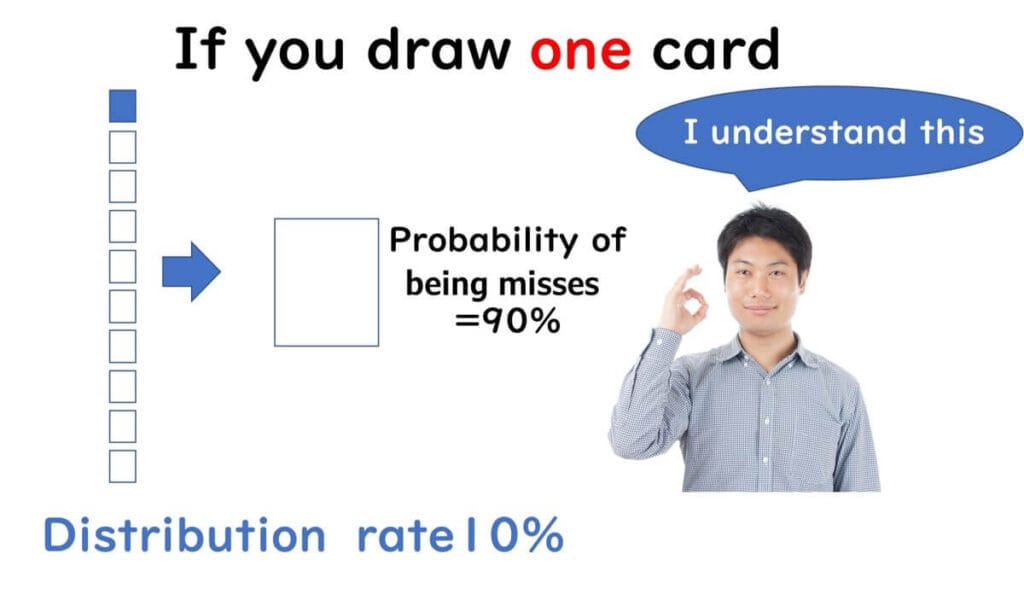
Imagine there are 10 tickets, and 1 of them is a winner. What is the chance of picking a losing ticket if you draw one? Most people can intuitively understand that the chance is 90%.
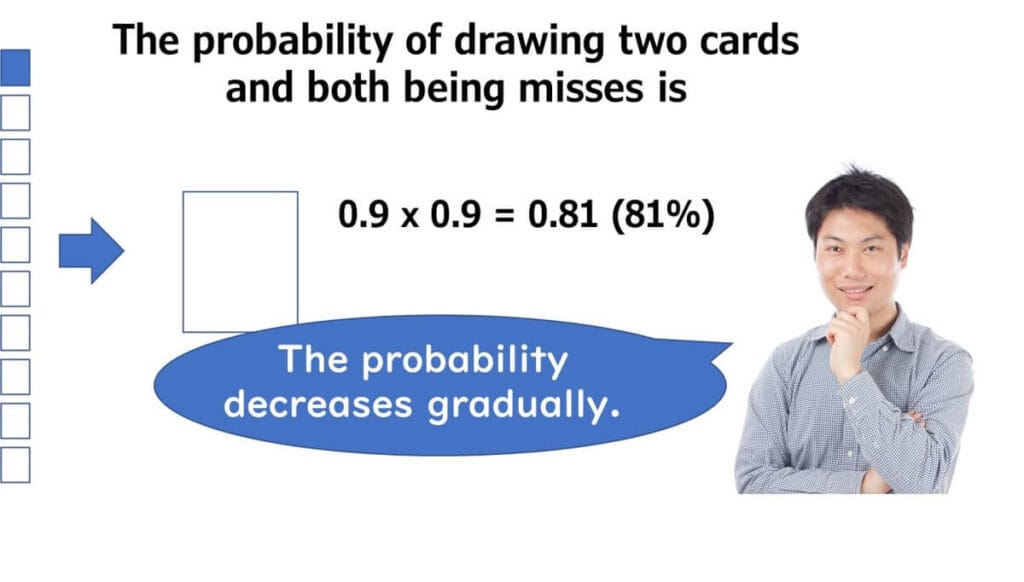
Now, what happens if you draw two tickets at the same time? The probability is 0.9 × 0.9 = 0.81. Since you're drawing two tickets, the probability of both being losers is lower than just drawing one.
To determine how much it decreases, you multiply the probability of drawing a loser the first time by the probability of drawing a loser the second time: 0.9 × 0.9 = 0.81 (81%)
Now, what if you draw three tickets? Using the same logic, it's 0.9 × 0.9 × 0.9 = 0.73 (73%).

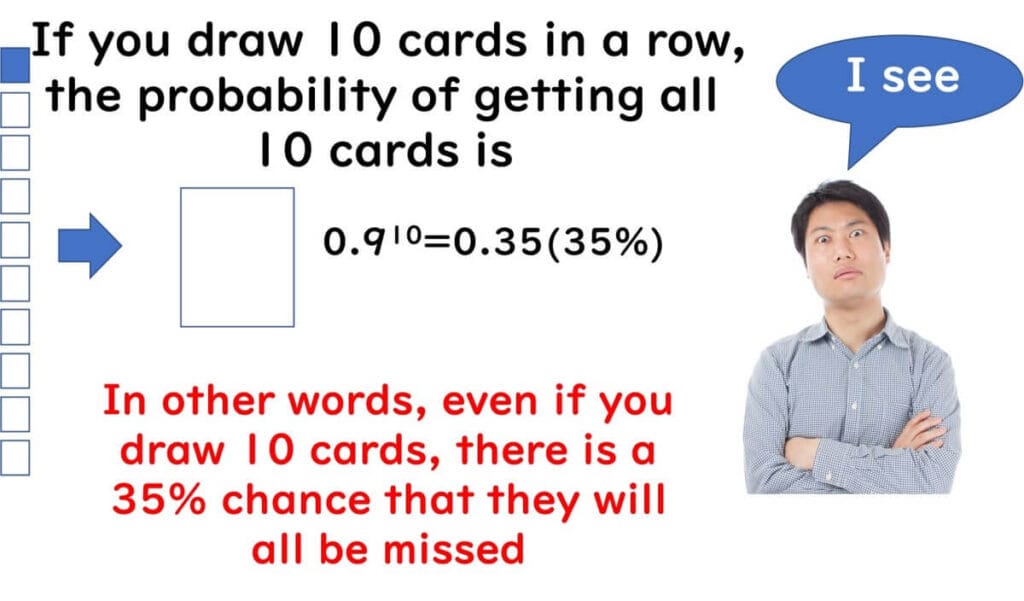
Using the same calculation method for drawing 10 tickets, the probability is 0.10 = 0.35. This means there's a 35% chance of drawing all losers.
Note: The above calculation is an approximation. As you draw each ticket, the number of remaining tickets changes, so the probability of drawing a loser also changes. Specifically, the probability starts at 90/100, then changes to 89/99, 88/98, and so on. However, when the sample size is very large, the change in the total number is negligible. Therefore, you can simplify the calculation by using a consistent probability of 0.9 for each sample and multiplying as shown. For small sample sizes, precise probability calculations are necessary. However, for very large sample sizes, the variations in probability are minimal, allowing for this approximation. This simplification is particularly useful in statistical analysis and probability calculations involving large datasets. This approach applies to microbial testing discussed later in this article.
In summary: Probability of getting a loser = (Probability of a loser ticket) (Number of draws)

Applying Probability to Microbial Testing
False Negatives in Food Microbial Testing
Why Introduce This Plan?
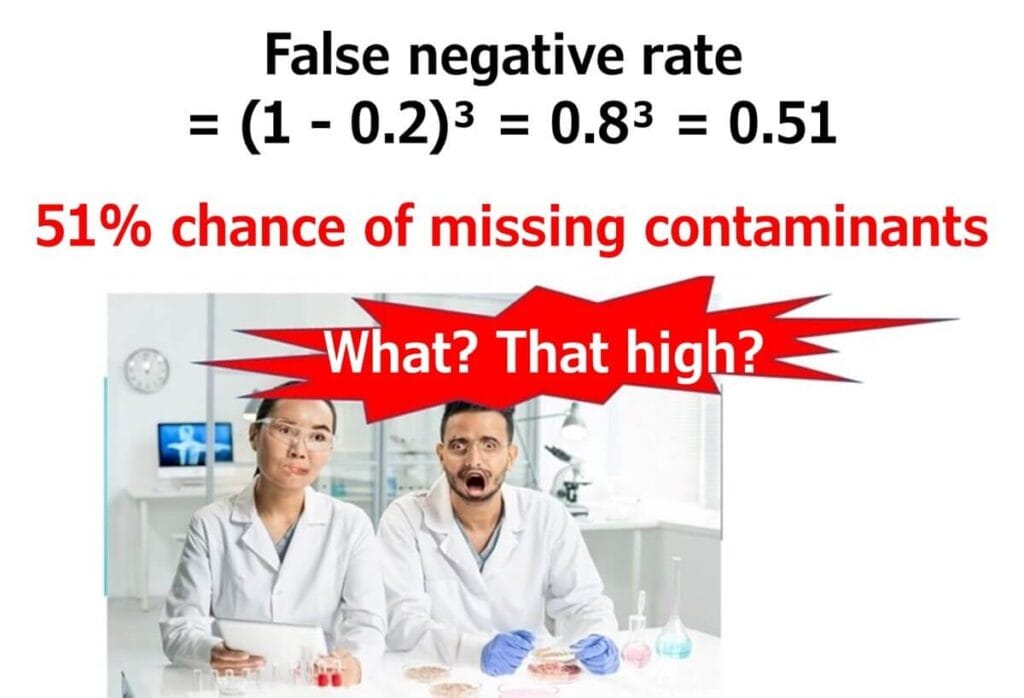
Suppose 20% of the samples are contaminated with Salmonella (contamination rate 20%). What is the probability of getting a negative result if we randomly test three samples?
In daily practice, we might not think about this too much and simply follow the company manual, testing one or three samples as inherited from past practices.

Food microbial testing can be understood using the same logic as the lottery example.
The probability of a false negative result is: (1-0.2)3 = 0.83 = 0.51
So, there’s a 51% chance of a false negative. This means that if we conduct this test and release the batch, we could have a contamination incident in one out of every two tests.
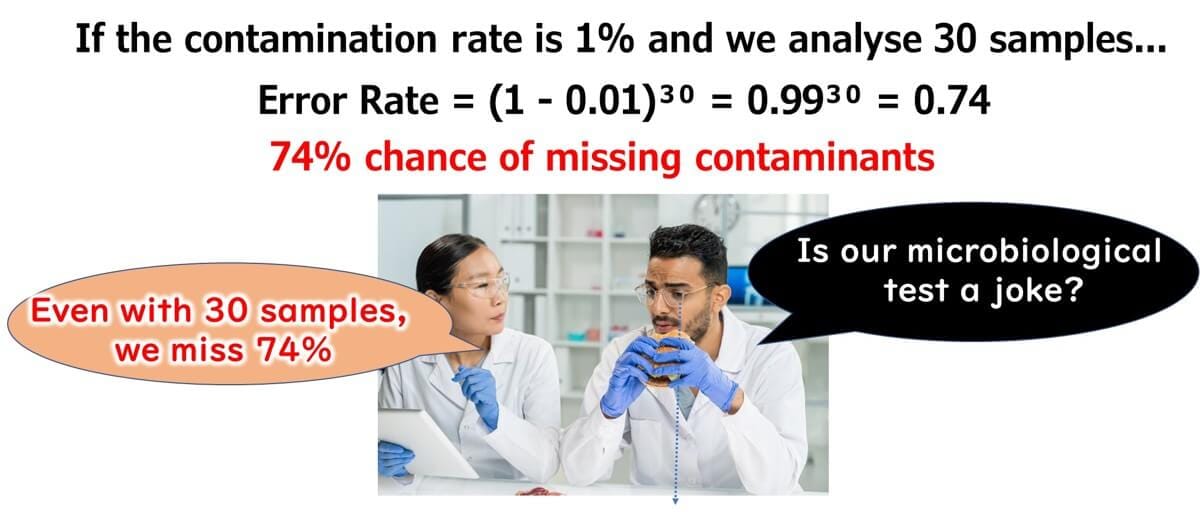
Let’s consider a product with a 1% Salmonella contamination rate. Suppose we test 30 samples. What is the probability of a negative result? (1-0.01)30 = 0.9930 = 0.74
Unfortunately, even with 30 samples tested, there’s a 74% chance of missing the contamination.
These calculations might lead some to question the significance of food microbial testing.
In reality, instead of over-relying on the results of microbial tests, it’s crucial to understand the accuracy of the tests being conducted by performing such calculations.
Why Testing Still Matters Is there no point in microbial testing with a small sample size?
Even with small sample sizes, microbial testing in food production is essential for detecting abnormal conditions in the products.

The above calculations assume a low contamination rate within the product.

However, in a food factory, contamination incidents such as microbial contamination from seasoning liquids or biofilms in specific areas can result in the widespread distribution of contaminants. Even with a small sample size, batch testing can detect such abnormalities.
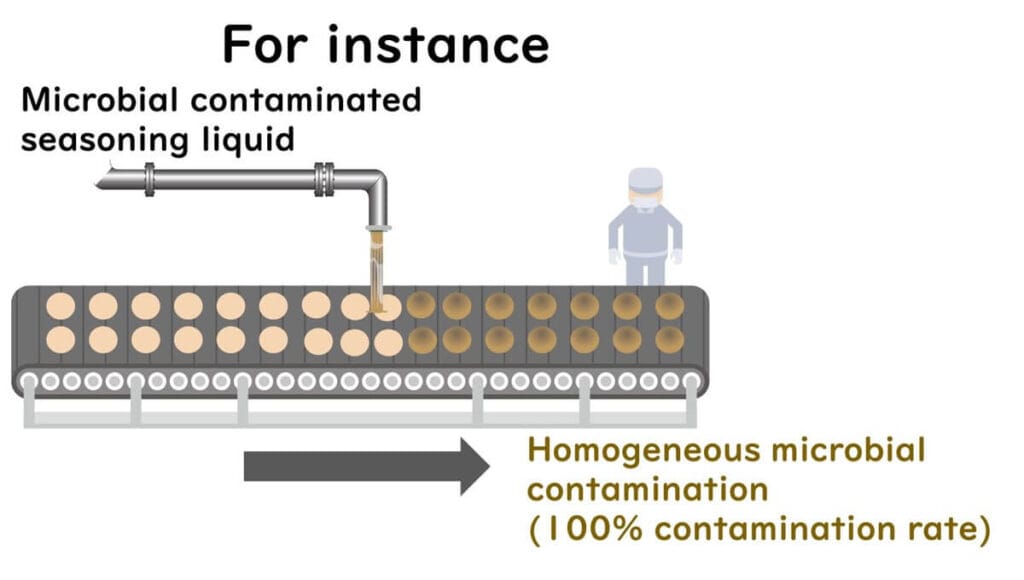
If the contamination rate is 90%, even testing just one sample yields: (1-0.9)1 = 0.1
This means a 90% chance of detecting a contamination incident.
Testing three samples yields: (1-0.9)3 = 0.001
Thus, there is a 99.9% chance of detecting contamination.

In any case, it's vital to remain cautious and not over-rely on the results of food microbial spot checks. We should always consider the possibility of uneven distribution in samples and think critically about microbial test results.
Microbial distribution in food can vary between uneven and even, with varying contamination rates. It’s crucial to apply these considerations to your factory’s products and interpret microbial test results accordingly.

Excel Calculations Explained via Video Now, let's try these calculations using Excel.
Check out the video below for a clear explanation on how to perform these calculations in Excel.

How Many Samples Are Needed for 95% Accuracy?
Reversing the Probability Formula
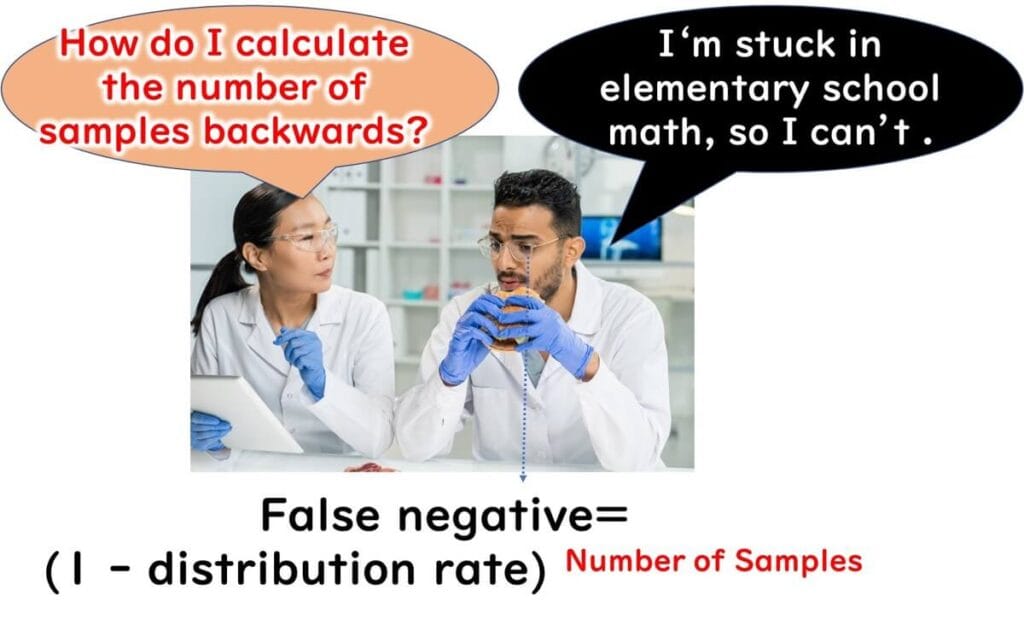
Next, let's reverse our previous calculations to determine how many samples are needed to achieve a specific false negative rate. For example, according to Codex guidelines, a correct test should have a false negative rate of 5%, meaning tests must be 95% accurate.
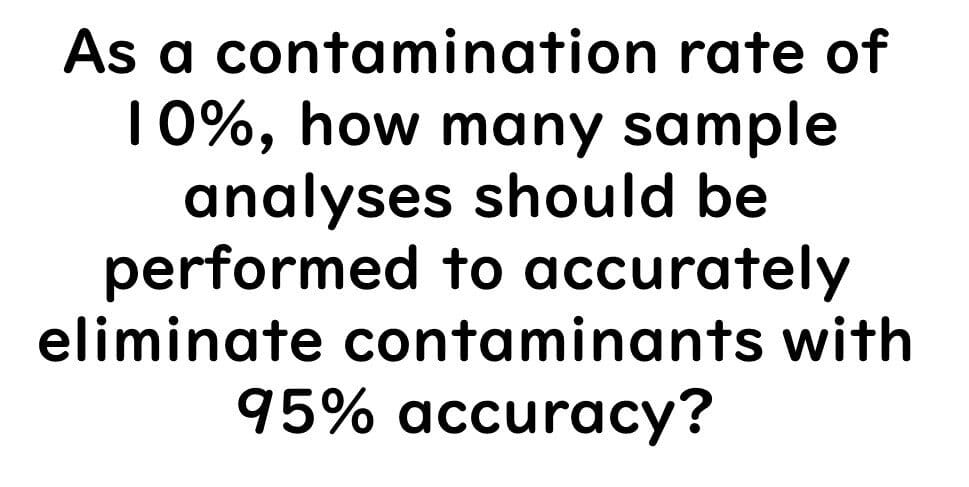
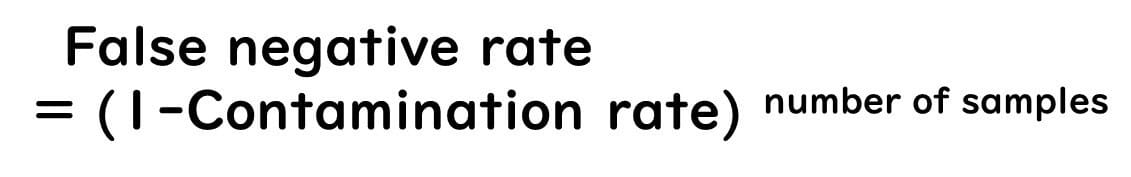
The calculation concept remains the same; the only difference is that the solution involves an exponent. Reversing the equation to find the number of samples might seem complex with primary school maths. False Negative Rate = (1 − Contamination Rate) Number of Samples
Log Calculations Needed but Basic Understanding Suffices
To solve this, we need to understand logarithmic (log) calculations.

While many of us might not have used logs since high school, understanding the basic definition is sufficient here.

Consider a number B raised to the power of A to get n: A = Bn In log notation, this relationship is expressed as: n = log_B(A)
To find n, we use Excel to calculate log_B(A).

Applying this to microbial testing: Number of Samples = log_(1−Contamination Rate)(False Negative Rate)
Excel Calculations Explained via Video
To perform these calculations in Excel, refer to the video for a detailed explanation.

How Experts Discuss This Internationally Understanding Discussions on Microbial Test Accuracy in International Expert Papers
For example, Dr. Zwietering, Chair of the International Commission on Microbiological Specifications for Foods (ICMSF) as of May 2022, discusses the following in his papers:
"If the microbial contamination rate in a batch is assumed to be 3.2%, to guarantee detecting defective ham products with 95% probability, a sampling plan of 92 units (c=0, n=92, tested as non-detect in 25g) is required. The underlying formula is:
Pdetect(n,c = 0, Pdefective)=1-(1-Pdefective)n
While this might seem like a complex equation, it essentially uses the same method explained in the video.
For detailed content on Dr. Zwietering's papers

Conclusion: Understanding the Purpose and Accuracy of Food Microbial Testing
When conducting microbial testing on food samples, it is crucial to understand the purpose and accuracy of the tests. Specifically, keep the following three points in mind:
Distribution Ratio of Contaminating Bacteria in Food: Assess this based on previous experience and data. Knowing how contaminants are typically spread within the food helps in planning effective sampling and testing strategies.
False Negative Rate for a Given Number of Samples: Calculate the probability of obtaining a false negative result when testing the specified number of samples. This understanding helps in evaluating the reliability of the test results and in making informed decisions about food safety.
Number of Samples Needed for 95% Accuracy: Determine how many samples need to be tested to achieve a 95% detection accuracy. This ensures that the testing process is robust enough to minimize the risk of undetected contamination, thereby safeguarding public health.
By focusing on these aspects, you can better appreciate the significance of microbial testing and apply this knowledge to ensure the highest standards of food safety.

Related posts:
The Role of Microbial Testing in HACCP (3) While HACCP aims to reduce reliance on end-product testing, microbial...
How HACCP Reduces Reliance on Microbial Testing Through Process Control (3) HACCP (Hazard Analysis Critical Control Point) is a system designed...

Discover expert-led lessons in food microbiology designed for professionals and beginners alike.

Author of this Blog: Bon Kimura
Bon Kimura, Professor Emeritus at Tokyo University of Marine Science and Technology (TUMSAT), specializes in food microbiology. He obtained his PhD from Kyoto University and became a professor at TUMSAT in 2006, serving as Dean of the Faculty of Marine Science from 2012-2015. Kimura has published over 200 international papers on food safety, pathogens, and spoilage bacteria. He has received multiple awards, including the Japanese Society for Food Microbiology Award (2019). Kimura also served as an editor for the International Journal of Food Microbiology from 2012 to 2024, where he was the principal reviewer for 1,927 papers.
Copyright © Introduction to Food Microbiology and Safety All Rights Reserved.